Showing posts with label Statistics. Show all posts

Monday, May 15, 2023

Statistical Models

Remember that all models are wrong; the practical question is how wrong do they have to be to not be useful.

-George Box

Tuesday, August 28, 2018

Images

Just some random images I've saved over the last little bit, because I thought they were funny:


Thursday, December 22, 2016

Confirmation Bias

This has been a different year. Even halfway through the year people were talking about how crazy 2016 is, and it hasn't disappointed. From the many celebrity deaths such as Gene Wilder, Prince, and Alan Rickman (many more, not a comprehensive list) to the Cubs winning the World Series to Donald Trump winning the presidency to snow in the Sahara Desert, it's been a wild ride.

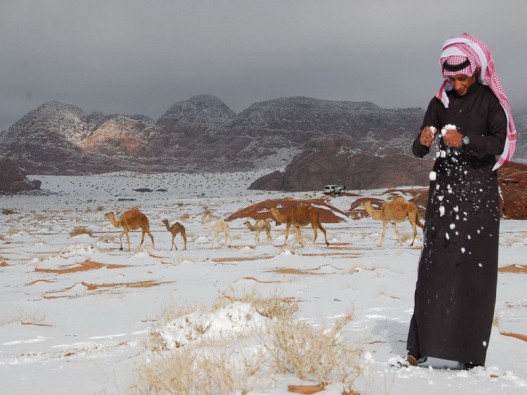
I don't like doing year end reviews before the year is over, because crazy or amazing things can happen all the way through the 31st of December. Those who created their lists during the first half of December would have missed the last item I pointed out above - snowfall in the Sahara:


Crazy! Beautiful, but crazy! Of course taking it to social media, the crazy takes a different turn. Instead of just enjoying the crazy beauty of nature, it turns into a political discussion related to climate change. And of course everyone sees just what they want to see. Those more concerned with the environment point this out as an indicator of climate change, and those more concerned with government overreach point this out as an argument against global warming. I will say that from a scientific point of view, the idea that global warming could not lead to snow in a place that is usually hot is actually a little backwards. Theoretically, global warming can lead to more moisture in the air, which can lead to snow, so it's not just about the temperature itself, which is part of why the other side has started referring to it as climate change instead of global warming. That doesn't stop me from making jokes when it's 10 degrees outside about how much I'm looking forward to global warming.

The issue is that neither side is really supported by this isolated event. Whether or not climate change or global warming is a thing, snow in the Sahara does not make or break either case. A consistent pattern one way or the other would lead more toward something measurable, but it's a rare enough event that I don't think we have enough information. It also snowed in 1979:


And if you look around there are reports of possible snow in the Sahara in 2005 and 2012. Four times in over 40 years hardly a pattern makes for either side.

Rather, what we have is a clear pattern of confirmation bias. Confirmation bias is when a person has an idea they hold to be true, and any evidence they see is molded around their world view to help them confirm what they already believe to be true. One side thinks the snow proves man is changing the world's climate, and the other side thinks the snow proves that we are not.

This is what in statistics we would call an outlier. The problem with outliers is that sometimes we ignore them because they are such a strange occurrence that it ruins our simple model even though it's important to consider what would cause that extreme case. The other problem with outliers is that sometimes we focus too much attention on them and treat them as if they are regular cases instead of just abnormal phenomenon. Statistically speaking it probably should snow in the Sahara once every couple decades.

Confirmation bias is related to cognitive dissonance, which is the idea that when confronted with conflicting evidence contrary to our existing view, the tension must somehow be resolved by either dismissing the new evidence or by adjusting it (often subconsciously) to fit the previous belief. For example, I haven't said if I think climate change is a thing or not, but people with strong beliefs one way or the other will tend to have one of two responses to what I've written. They will either apply what I've written about how this doesn't prove anything just to the other side's argument if they believe what I'm saying or if they don't like what I'm saying they will read it as though I agree with the other side and say that I'm actually wrong about the weakness of the evidence.

Think through what I've written and by identifying how you react to my position that the snow doesn't mean as much as you think it means may help you understand where your own biases are positioned. Only by recognizing and understanding your own bias can you do anything about it.

Thursday, December 4, 2014

Cluster Analysis and Special Probability Distributions - An Annotated Bibliography

Antonenko, P., Toy, S., & Niederhauser, D. (2012). Using cluster analysis for data mining in educational technology research. Educational Technology Research and Development, 60(3), 383-398.

Server log data from online learning environments can be analyzed to examine student behaviors, in terms of pages visited, length of time on a page, order of links clicked, and so on. This analysis is less cognitively taxing to the student than think aloud techniques and to the researcher since there is no coding of behaviors involved. Cluster analysis groups cases such that they are very similar within the cluster and dissimilar to other cases outside the cluster across target variables. It is related to factor analysis, where regression models are created based on a set of variables across cases, but in cluster analysis, cases are then grouped. Proximity indices (squared Euclidean distance or sum of the squared differences across variables) are calculated for every pair of cases. Squaring makes them all positive and accentuates the outliers. Various clustering algorithms are available to then group similar cases. Ward’s is a hierarchical clustering technique that combines cases one at a time from n clusters to 1 cluster and determines which minimizes the standard error, and is used when there is no preconceived idea about the likely number of clusters. Using k-means clustering, a non-hierarchical techniques, an empirical rationale for a predetermined number of clusters is tested. It may also be used when there is a large sample size in order to increase efficiency; if no empirical basis exists, the model is run on 3, 4, and 5 clusters. The method calculates k centroids and associates cases with the closest centroid, repeating until the standard error is minimized by allowing cases to move to a different centroid. It may also be possible to use two different kinds of techniques, for example, a Ward’s cluster analysis on a small sample followed by a k-means cluster analysis based on the findings from Ward’s. After determining the clusters, the characteristics of each cluster should be compared to ensure there is a meaningful difference among them and that there is a meaningful difference in the outcome based on their behaviors, since cluster analysis can find structures in data where none exists. ANOVA may then be used to determine for each cluster how much each variable contributes to variation in the dependent variable. It may be useful to use more than one technique and compare or average them, as different techniques may result in a variation in the results.

Bain, L.J. & Englehardt, M. (1991). Special probability distributions. In Introduction to probability and mathematical statistics (2nd Edition). Belmont, CA: Duxberry Press.

A Bernoulli trial has two discrete outcomes whose probabilities add up to 1. A series of independent Bernoulli trials forms a Binomial distribution, where the number of successes (or failures) are determined for n trials. A Hypergeometric distribution occurs when n samples are taken from a population of N+M without replacement. It can be useful for testing a batch of manufactured products for defects in order to accept or reject the batch. The Geometric Binomial distribution determines the minimum number of Bernoulli trials that must occur to achieve a success. The Negative Binomial distribution determines the minimum number of Bernoulli trials that must occur to achieve n successes. The Poisson distribution describes the probability of n independent successes occurring over a certain number of trials. The discrete uniform distribution allows for n possible values, each with equal probability of occurrence.

Blau, B.M., Brough, T.J., & Thomas, D.W. (2013). Corporate lobbying, political connections, and the bailout of banks. Unpublished manuscript, Department of Finance and Economics, Utah State University, Logan, UT.

When measuring a dependent variable with discrete values, an appropriate count regression framework must be used. Poisson, negative binomial, and OLS are possible models to use. Poisson regression uses a distribution where the mean is equal to its variance. If the distribution is over-dispersed or significantly greater than 0, Poisson will not work. No discussion of when negative binomial or OLS work.

Collins, L.M. & Lanza, S.T. (2010). Latent class and latent transition analysis for the social, behavioral, and health sciences. New York: Wiley. Latent variables are unobserved but predicted by the observation of multiple observed variables. The latent variable is presumed to cause the observed indicator variables. Different models are used, depending on whether the observed and latent variables are discrete or continuous. Using a discrete latent variable helps organize complex arrays of categorical data. A given construct may be measured using either continuous or discrete variables, so the method used when there is a choice should be based on which best helps address the research questions. When cases are placed into classes, the classes are named by the researcher based on their similar characteristics.

Fisher, W.D. (1958). On grouping for maximum homogeneity. Journal of the American Statistical Association, 53, 789-798.

Grouping or clustering is a useful tool for distinguishing sets of cases based either on prior theory of what the groups should entail or with no initial structure in mind. Combining the groups has a goal of minimizing the variance or error sum of squares. For some small cases, a visual inspection of data may allow the researcher to come up with the clusters. In large data sets with evenly dispersed data, this is difficult or impossible.

Francis, B. (2010). Latent class analysis methods and software. Presented at 4th Economic and Social Research Council Research Methods Festival, 5 - 8 July 2010, St. Catherine’s College, Oxford, UK.

Latent class cluster analysis assigns cases to groups based on statistical likelihood; they do not have to be assigned to discrete classes. K-means clustering is problematic, since the number of groups has to be specified a priori, cases are assigned to unique clusters, and only allows continuous data.

Gardner, W., Mulvey, E.P., & Shaw, E.C. (1995). Regression analyses of counts and rates: Poisson, overdispersed Poisson, and negative binomial models. Psychological Bulletin 118(3).

Researchers often use suboptimal strategies when analyzing count data, such as artificially breaking down counts into categories of 5 or 10, but this loses data and statistical power. Another ineffective strategy is to use regular linear regression or OLS. Using OLS, illogical values, such as negatives will be predicted, and the model’s variance of values around the mean is not likely to fit well. Another problem with OLS is heteroscedastic error terms, where larger values will have larger variances and smaller values small variances. Nonlinear models that allow for only positive values and describe likely dispersion about the mean must be used. Poisson places restrictive assumptions on the size of the variance. The Overdispersed Poisson model corrects for the large variances that are common. The negative binomial is another option. In the regular Poisson model, truncated extreme tail values could lead to underdispersion and a large number of high values could lead to overdispersion. An overdispersion parameter is calculated by dividing Pearson’s chi-squared by the degrees of freedom and then the overdisperson parameter is multiplied by the mean. The negative binomial model includes a random component that accounts for individual variances. The negative binomial model allows one to estimate the probability distribution, where the overdispersed Poisson does not.

Osgood, D.W. (2000). Poisson-based regression analysis of aggregate crime rates. Journal of Quantitative Criminology 16(1).

The normal approach to analyze per capita rates of occurrence is to use the OLS model. However, OLS does not provide an effective model when recording a small number of events. For large populations, OLS may work, but for a small number of events in a small population, the results is an overestimated rate of occurrence. Often small counts will be skewed with a floor of 0. The Poisson model corrects for many of these issues with OLS; however, the unlikely assumption of the Poisson’s mean equaling the variance must hold. Due to individual variations and correlation between observed values and variance, overdispersion is common. Adjusting the standard errors and thus t-test results for the overdispersion helps correct the model. The negative binomial model combines the Poisson distribution with a gamma distribution that accounts for unexplained variation.

Romesburg, H.C. (1990). Cluster Analysis for Researchers. Malabar, FL: Robert E. Krieger Publishing Company.

The steps in doing cluster analysis begin with creating the data matrix, including objects and their attributes. The objective is to determine which objects are most similar based on those attributes. An optional step is to standardize the data matrix. A resemblance matrix is then calculated, showing for each pair of objects a similarity coefficient, such as the Euclidean distance. Based on the similarity coefficient, a tree is created by combining similar objects and comparing their average to the other existing objects. Then rearrange objects in the data matrix to show the closest objects next to each other.

Velasquez, N.F., Sabherwal, R., & Durcikova, A. (2011). Adoption of an electronic knowledge repository: A feature-based approach. Presented at 44th Hawaii International Conference on System Sciences, 4-7 January 2011, Kauai, HI.

This article discusses the types of use for knowledge base users. It utilizes a cluster analysis to come up with three types of users. Clustering methods compared were Ward’s, between-groups linkage, within-groups linkage, centroid clustering, and median clustering and the one with the best fit was used.

Wang, W. & Famoye, F. (1997). Modeling household fertility decisions with generalized Poisson regression. Journal of Population Economics 10. Poisson and negative binomial models account for non-negative counts of discrete occurences. The Poisson model requires that the mean and variance of the dependent variable are equal, which is rarely true. This leads to a consistent model but invalid standard errors. The negative binomial model handles counts with overdispersion. When underdispersion is present, a generalized Poisson regression model may be used. Generalized Poisson handles both overdispersion and underdispersion.

Ward, J. H., Jr. (1963), Hierarchical Grouping to Optimize an Objective Function, Journal of the American Statistical Association, 48, 236–244.

Ward describes a clustering technique that allows for grouping with respect to many variables in such a way that minimizes the loss in each group. Traditional statistics would take a group of numbers, find the mean, and then calculate the error sum of squares for all cases and the one mean. By grouping, the ESS will be minimized as they are compared to the group means. The appropriate number of groups can be determined in the grouping process rather than needing to specify it in advance.

Monday, March 31, 2014

The Statistics of a Degree

This video posits that the school system somehow robs students and that they will be better off if they don't get a degree. Instead they should educate themselves on the street or in their garage. The performer (yes, he's performing to get a YouTube paycheck by millions of us watching his video and associated advertisements) asks the watcher to look at the statistics, and then proceeds to list off a dozen predictable outliers who were wildly successful without graduating from college.


Let's actually look at the statistics, shall we?


Maybe you're special and will be the next outlier. Maybe our schools could do things more efficiently (okay, not maybe; they do need an overhaul). Maybe you'll be more likely to have a higher paying job if you get a degree.

Saturday, March 9, 2013

Congressional Term Limits

It's past time for a serious discussion of term limits in the U.S. Congress.  The current system of seniority holding so much power leads to situations like the one we have now, where they have abysmal approval ratings, yet the states keep sending back the same people.  The problem is that while no one likes what is going on, no one is willing to lose the power they believe they have through decades of seniority.

The problem is that the people don't have the power.  Again, they believe they do, but they don't.  Their congressional delegation has the power.  Each state sends back their own delegation and hopes that all the other states replace theirs with new people.

I was looking up something in the Constitution (something I think most of Congress hasn't spent much time doing recently), and I found something really eye-opening to me.  The U.S. Senate website has a copy of the Constitution on their webpage.  Great.  Thanks for that nice service.  Of course, they go so far as to interpret it for us.  Okay, so I know we're in murky waters when it comes to trusting their interpretation of the Constitution, especially since that responsibility falls in the lap of another one of the three branches.

Before even getting to the preamble, there is a short introduction.  It points out that the first three words, "We The People", stress the fact that the government is to serve its citizens.  Great so far.  And stop.
The supremacy of the people through their elected representatives is recognized in Article I, which creates a Congress consisting of a Senate and a House of Representatives. The positioning of Congress at the beginning of the Constitution reaffirms its status as the “First Branch” of the federal government.
I'm good where they say that government should serve the citizens and that the people hold supreme power, but that's not where they're going with it.  The Senate's claim is that not only is Congress the first branch of the government, but in effect, they are the people.  That is, our power is not inherent in that we are the citizens of the country but that our power is made manifest through Congress.  We are not supreme but rather supreme through our elected representatives.

I get that we are a republic and as such the statement they make is true from a certain point of view.  Our power, however, is supreme, in that we can replace those elected representatives.  The only problem is that we are tricked into not exercising that power by rules Congress puts in place to promote their own longevity.  So what we need to do now is push for a rule that limits longevity and promotes turnover and new ideas.

So where do we put the limit?

To figure out if there is a natural break, I grabbed a list of all current members of the House and Senate, all elected under an open market, if you will, with no term limits.  The average length of time current members of the Senate have been serving is 9.6 years, with a standard deviation of 9.8.  Given a normal distribution, two thirds of a population are within one standard deviation of the mean (0-18).  Since there is a hard cut-off at 0, one standard deviation below the mean, the percent actually drifts a little higher at the other end.  16% have actually been in office for longer than 18 years, more than one standard deviation.

Interestingly enough, the numbers are almost exactly the same in the House even though Representatives are elected every 2 years, while Senators are elected every 6 years.  The average tenure of current members of the House is 8.9 years, with a standard deviation of 9.5.  Likewise, 16% (71/435) have been in office for longer than 18 years, which is again, one standard deviation above the mean.

An interesting stat with members of the Senate is that almost exactly 50% of them served in the House before being elected to the Senate, so the numbers are actually even more skewed in the Senate if you include their full tenure in Congress.

While I'd be more tempted to place the limit at 12 years - 2 terms for Senators and 6 for Representatives, I'm actually okay with giving them 18, although if you let me think about it too much longer, I might talk myself back down to 12.  Only 16% really overstay their welcome all the way past 18 years, and those are more likely to be the extreme sociopaths.  If we cut it off at 12 years, we'd be skimming off the top 28% in both the House and Senate (still interesting how the percentages stay the same, 28 in the Senate and 122 in the House).  If the 18 years was a cumulative total between the House and Senate, that would perhaps make up for going with 18 instead of 12.  There would be a more steady churn from House to Senate and from Senate out to pasture (jobs with lobbying firms or a run for the presidency).

So where do we draw the line?

Wednesday, November 21, 2012

Origin of the Universe

I occasionally ponder on the origins of the earth. When I was younger I could make my brain hurt trying to think of how there could have always been something that existed somewhere and how there is no end to anything, yet everything we know is that there is always a start and end. So how did we start if there was nothing there to start it? I don't worry about that anymore. Why? A scripture in the bible solved it for me, and not the one in 2 Peter 3 about a day for the Lord being 1000 years for us, but one in Revelation of all places.

Revelation 10:5-7

5 And the angel which I saw stand upon the sea and upon the earth lifted up his hand to heaven,

6 And sware by him that liveth for ever and ever, who created heaven, and the things that therein are, and the earth, and the things that therein are, and the sea, and the things which are therein, that there should be time no longer:

7 But in the days of the voice of the seventh angel, when he shall begin to sound, the mystery of God should be finished, as he hath declared to his servants the prophets.

So time will be turned off. It's a temporary constraint to our understanding. I don't understand what the big picture is, but I know time isn't permanent. At least I believe it doesn't, to the extent that it no longer gives me headaches.

A few days ago I saw this graphic posted who knows where, which I tried to track down, and I can't figure out the original source, so if anyone knows where it came from, let me know so I can give proper attribution. The idea is that none of us knows what is truly real. There are real things we can't see just as there are things we see that aren't real. There are always people who think they have it all figured out, whether based on their interpretation of the bible or on what Bill Nye tells them. The truth is that none of us knows the truth, and with apologies to Jack Nicholson, we probably can't handle the truth.

It then makes me wonder when I see an article like this one that purports to explain Why Marco Rubio Needs To Know That The Earth Is Billions Of Years Old. Go read it if you want. The author, who is a technology writer for Forbes (not a theologian or a scientist), calls out Marco Rubio for answering truthfully that he doesn't know how old the earth is. Rubio states that he is neither a theologian or a scientist, and none of those experts can agree, so he's leaving the debate up to them.

The interesting point that is called out of the many that could have been is that if the earth isn't billions of years old, then all our DVD players will stop working, laser surgery will start failing, and our nuclear reactors will all blow up tomorrow (Are you paying attention, Mayans?) because everything we know about science is wrong.

Awkward pause.

Just a minute while I finish looking up the Wikipedia article on logical fallacies.

One of the most important ideas that I learned about in the multivariate statistics class I took in my PhD program (which I will get to blogging about in a couple years at the rate I'm going) is the principle of parsimony. The idea is that you go with the model that is the appropriate balance between simplicity and completeness, or you start with the simplest hypothesis, with the fewest number of assumptions, and work towards the more complex ones.

Thinking about all the elements that would have had to blow up just right to form new elements and align themselves somehow into what would become self-aware beings is a bit complex for me and the basis of another big headache. That's not to say I don't believe the earth is billions of years old, or that at least the materials used to create the earth are that old. I said before that it gives me comfort that time will be turned off at some point, but that doesn't mean that time doesn't still exist and play a role in our larger existence, just that it won't be limiting as it is now.

Foes of the religious will dismiss what I'm about to say as me dealing with my cognitive dissonance, but hear me out. This is the parsimonious model I've come up with that brings together my belief in the bible and the creation and in my understanding and trust of scientists. Matter in various shapes and forms has existed for a long time, billions of years or more even. The universe has existed for billions of years. God has existed for billions of years. If we read the biblical history literally, our earth was only created maybe 10,000 years ago, depending on when the clock started ticking. It was created from remnants of other worlds and placed with our solar system into the universe that already existed.

The laws of nature, such as how light works, gravitational pull, and chemistry, are constant. They haven't changed. Our DVDs will still work tomorrow. At least I hope the laws of physics will last long enough for me to see The Hobbit. We just have some billion year old recycled pieces of another planet that happened to have animals that were a lot scarier than the ones we have now. No, dinosaurs never walked this planet. They walked on another planet, a long time ago in a galaxy far, far away. Not reasonable? Which is more far-fetched? God recycled the dinosaur's planet in making ours or the earth and dinosaurs evolved from nothing, they were all killed from a meteor and resulting ash cloud, and then we evolved again from nothing? The scientists are guessing when they come up with their hypotheses about why the dinosaurs went away. They don't know. So why is my guess of a hypothesis any worse off than theirs? Which is more parsimonious?

I learned within the past year or two about dark matter. Granted I don't know a lot about it, but the basics of it is that there is something that exists in such a way that it increases the mass (and thus the gravitational pull) of galaxies but that cannot be seen. Wait, let's think about that. We know (or think we know) how gravity works. But something in the galaxy behaves in a way inconsistent with our understanding of gravity. So scientists hypothesize that there is a mysterious, invisible matter that accounts for 84% of the mass of the universe in order to make their previously held theory (gravity) continue to work. Now is a good time to refer back to the cognitive dissonance link in the "Foes of the religious..." paragraph above.

Understanding how the universe works seems to me to be a completely separate question from how we and the particular world we live on were created. They still don't know for sure where the moon came from. But we do know it's there and can predict its movements and measure its effects on the tides. We don't know where the dinosaurs came from or how they died, but we do know that their rotting flesh makes good fuel for powering our cars and heating our homes. Well, maybe oil comes from dinosaurs.

My pointing out the great deficiencies in the knowledge of scientists does not mean I think they are idiots but rather to point out that any of the things they say about religious folks could apply equally to them. I do respect scientists, and I believe that many useful discoveries can be made by investigating the origin of the universe, just as much as studying the operation of the universe. As of next month (December 2012), it will be 40 years since a man last stood on the moon, and I think we should go back.

More importantly, I think we should be more respectful of one another's ideas, because if I'm right, then both theologians and scientists are right. If I'm not right, chances are both of them are wrong with me as well, and neither has the standing to point out the flaws of the other.

Friday, March 30, 2012

Business Statistics

Business Statistics was one of the few courses in a massive auditorium that was actually good. Its quality was largely due to the highly entertaining professor. He knew the material, knew how to teach, and he was able to keep us entertained.

One of my favorite parts of the course was that generally once per class period, although I don't remember if he did it every time, he would randomly stop and ask someone to ask him a question. It didn't matter what. Maybe it was related to the class, and maybe it wasn't. Preferably it wasn't. I remember one question in particular. Someone asked him what was in his backpack. So he opened it up and showed us. He had about a dozen dry erase markers and some tiny running shorts. Classic.

I recall one class period where the normal professor was going to be gone, so he arranged a guest lecturer for that day. As soon as some people saw it was someone else, several of them left. After a few minutes, more people recognized the guy was somewhat clueless and left. This continued until people were leaving en masse. I don't know how many people stuck it out, as I left about midway. Even with as many people as had left, it took several class periods for the normal professor to undo the damage done by the guest lecturer.

A nice facet of the class, given the huge 300 person auditorium nature of it, is that we had a lab one day a week where we would meet with a TA and a smaller group of about 20-30 students. This gave us the opportunity to discuss course topics in a more personal setting. Our lab met on the fourth floor of the old Merrill Library, which has since been demolished and had a new building take its place. At the time, the library had the slowest elevator on campus. After it was torn down, the new science building I worked in, in spite of it being one of the newest and nicest buildings on campus, took the title of slowest elevator. I still remember the sight as they tore down the old library, that the elevator shafts were the last pieces of the building still standing after everything else had been dismantled. I can't find the pictures I took of the demolition, so here's a picture of part of the outside of the building. The elevator had a staircase wrapped around it. It was so slow that it was always faster to take the stairs, but there was still always a line of people waiting to get in the elevator anyway. I didn't help speed things up any as I would hit the elevator call buttons on each floor as I'd run up to the fourth floor, making the slowest elevator on campus have to stop on every floor while it brought my classmates up.

There was a small group of guys in my lab that would study together. They never invited me to study with them, for whatever reason. I just kind of did that on my own. We would always talk about what scores we got on our tests and homework, though, and it always frustrated them that I would score so much higher than them. Then they would work themselves up even more by asking how much time I had spent studying or working on my homework assignments, and it was significantly less time than they had. Hey, between a part time job and four other classes that semester, I didn't have a ton of extra time. Statistics came pretty naturally to me, so I didn't have to exert myself too much. If the guys had invited me to join their group, I probably would have, and we might have all learned more. I still remember trying to reassure them that since they were spending so much more time studying than I did, they were sure to remember what they learned more than I did, in spite of my higher grades. Their response was a classic college student response, that they didn't care if they remembered it later as long as they could perform for the test.

A fun part of our tests was that there were always a few questions based on a recent newspaper article that was photocopied along with the test. There would be various questions asking us to analyze the numbers given, determine what was suspiciously absent, and talk about whether we thought they were hiding something or blowing smoke. Hint: they were always hiding something or blowing smoke. This was a great way to apply statistics to daily life. As I've said before, I believe that statistics should be taught in high school and college, rather than calculus. We are always hearing about scientific and non-scientific polls, margins of error, medical studies that say coffee reduces your risk of heart attack, medical studies that say that coffee increases your risk of heart attack, free throw percentages, batting averages, probabilities here, people taking credit for things they have no control over there, and so on. We would do well to understand what all these statistics mean in order to understand when someone is hiding something or blowing smoke.

Hint: They're always hiding something or blowing smoke.